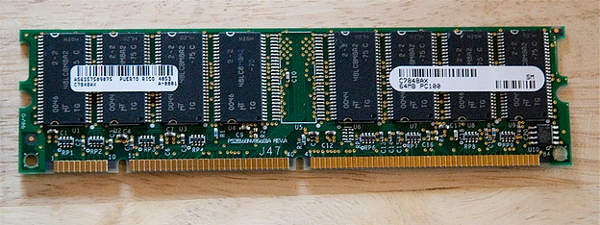
Last month, we had discussed various memory errors such as uninitialised memory reads and bit undefined errors. We also discussed the concept of shadow memory, wherein extra metadata maintained in memory is used to track the state of each memory location in an application’s address space. Shadow memory contains information on the state of each memory location used by the application, so that it can be used by an analysis tool to detect various errors.
For instance, consider that the analysis tool supports a shadow memory infrastructure wherein every word of the application’s heap memory has a corresponding shadow word memory; and whenever the application’s heap memory is initialised during the application’s execution, the corresponding shadow word records this information. So if we are asked to find out whether a particular memory location is initialised or not, at the point of its use, all that the tool needs to do is to look up the corresponding shadow word which contains that information.
In this month’s column, we continue our discussion of shadow memory. A couple of our readers, R Manohar and N Sudeep Kumar, had questions on how dynamic instrumentation is typically implemented, and how they can write their own custom tools on top of a dynamic binary instrumentation framework. We will address these questions in this column. First, let’s take a quick look at the various approaches to application instrumentation.
Instrumentation approaches
While our discussion (last month) on memory error checking was limited to binary instrumentation, there are different instrumentation approaches possible, depending on the purpose for which the instrumentation is being done. For example, if users want to find out how many branch instructions are encountered during program execution, the simplest approach is to do a binary instrumentation that looks for branch opcodes in the execution of instructions.
On the other hand, consider a user who wants to find out how many times a function foo was called with the first argument being zero and the second argument being 1, from the parent bar, when bar was called with the first argument being NULL. Such an arbitrary instrumentation requires deeper application-path analysis, and is typically done easily on source code or an intermediate representation, where the code representation is quite close to high-level language constructs. The various popular instrumentation approaches are enumerated below.
Source-code instrumentation
This is typically done at the preprocessor level, wherein the instrumentation code in the same high-level language is inserted into the application source code; and the application is then compiled and linked normally. Since the instrumentation code is part of the application code as it compiles, it can be optimised by the compiler. The instrumentation code kicks in and executes when the application binary is executed at runtime.
Compile-time instrumentation
This is during the compilation of the source file, and the instrumentation is typically performed by the compiler on the intermediate representation. This facilitates the use of the compiler’s knowledge of the application in optimising the placement of the instrumentation code, and allows it to improve the performance of the instrumented executable. For example, the GCC compiler allows injection of gprof profile code through compiler-based instrumentation. GCC also supports an option known as -finstrument-functions, which automatically traces all function entry and exit points for user code functions.
Link-time instrumentation
This instrumentation happens during the post-linking phase of the object files, and is also known as object-code instrumentation. The instrumentation tool adds the instrumentation code on top of the application’s object code. A well-known example is the memory error detection tool Purify.
Static binary instrumentation
This instrumentation happens on the static binary executable. The instrumentation tool parses the executable, and adds the instrumentation code as machine-code instructions. Static binary instrumentation inserts additional code and data into an executable, and generates a persistent modified executable. Atom is a well-known static binary instrumentation framework available on the Alpha processor platform for the Tru-64 operating system, available here. A number of popular tools, such as Pixie and Hiprof, have been built on top of it. However, since it is available only for the Alpha platform, it is not useful for today’s popular general-purpose processors.
Dynamic binary instrumentation
Dynamic instrumentation tools insert additional code and data during execution, without making any permanent modifications to the executable. The main advantage of dynamic binary instrumentation is that it is applied at runtime, and hence can take advantage of the runtime information available, and use that information to optimise the inserted code. The second advantage is that since the instrumentation code is not persistent, different types of instrumentation can be applied for different runs on the same binary, without requiring recompilation or relinking.
Also, since the instrumentation is done at runtime, it facilitates the application of instrumentation code to a running application without having to stop and restart the application. Once the required information has been collected, the tool facilitates the removal of the instrumentation code so that the executable runs as-is, without the instrumentation overhead from then onwards. This is not possible with statically instrumented executables. With dynamic binary instrumentation, additional overhead is introduced, because the instrumentation tool must perform additional tasks such as parsing, disassembly, code generation, and making other decisions at runtime.
The biggest advantage of binary instrumentation tools, both static and dynamic, is that they do not require source code. This is important because in many cases, the applications can be legacy binaries, or may consist of third-party libraries where source code may not be readily available.
Dynamic Binary Instrumentation (DBI) frameworks
A dynamic binary instrumentation framework offers facilities which allow an analysis tool to add instrumentation dynamically at runtime on a binary executable with minimum effort. There are a number of popular DBI frameworks available, which are listed below.
Pin
Available from pintool.org, this is written along the lines of the Atom framework. Unlike Atom, Pin supports dynamic instrumentation of user applications, allowing arbitrary code written in C/C++ to be injected into arbitrary places in the executable.
Pin provides a rich API that abstracts away the underlying instruction-set idiosyncrasies, and allows context information such as register contents to be passed to the injected code as parameters. Pin automatically saves and restores the registers that are overwritten by the injected code, so the application continues to work. Limited access to symbol and debug information is available as well.
It supports Linux binary executables for Intel IA-32, Intel64 (64 bit x86), and Itanium (R) processors and Windows executables for IA-32 and Intel64. A good tutorial on the Pin framework and tools that can be developed on top of it is available as here [PPT].
If you are looking for an interesting academic project related to building a performance-profiling or instrumentation tool, Pin is definitely a framework to consider. However, unlike other open source DBI frameworks like Valgrind, only the source code for the tools is made available, while the source code for the instrumentation framework itself is not made available. Therefore, you cannot make enhancements to the DBI itself; you can only write tools on top of existing facilities.
DynamoRIO
This is another popular DBI platform, based on the Dynamo dynamic optimisation framework. Its source code and binaries are available from from its website. It supports instrumentation of Windows and Linux IA-32 binaries. There are not as many popular tools on DynamoRIO as there are on Valgrind or Pin. Dr Memory is the popular memory error-checking tool built on top of DynamoRIO.
DynInst
Another popular instrumentation framework that supports both static and dynamic binary instrumentation is DynInst, which provides a machine-independent API that allows insertion of code to a static or dynamic binary. It is available for both Windows and Linux.
A number of tools have been built on top of DynInst, such as SGI SpeedShop and Dynamic Probe Class Library (DPCL). The former is a performance profiler tool. DPCL is an object-based C++ class library that exports the necessary class interfaces for DBI.
Valgrind
To date, this is the most popular DBI framework in open source. A number of tools have been built on top of Valgrind, which include the popular memory error-checking tool MemCheck. Valgrind supports heavy-weight dynamic binary instrumentation and complete shadow memory support. The comprehensive nature of Valgrind allows one to build very sophisticated tools, which may not be possible with DynamoRIO or DynInst.
If you are a student looking to build an interesting tool using binary instrumentation, Valgrind is definitely the platform for you. It allows extensions to the core Valgrind platform itself, as well as building tools on top of it. It has a very active user and developer community.
Approaches in adding instrumentation code
There are two major approaches in DBI when adding the instrumentation code. One approach is what is known as a ‘Disassembly and Resynthesise’ (D & R) approach, where the binary executable is first disassembled, analysed, an intermediate representation is built, on top of which the instrumentation code is added, and then the complete code containing both the original application and the instrumentation code is lowered to the machine level.
The other approach is what is known as “Copy and Annotate” (C & A), wherein the incoming instructions of the application binary are copied through, as is. Each incoming instruction is annotated with its effects via data structures, as in DynamoRIO, or through an instruction querying API, as in Pin.
Instrumentation tools use the annotations to guide the instrumentation. Instrumentation code is inter-leaved with the original application binary without causing any perturbation.
Valgrind uses the D & R approach, whereas Pin and DynamoRIO use the C & A approach. Each approach has its own advantages and disadvantages. D & R is heavy-weight, and can add to runtime execution overhead. C & A is lightweight, and can be faster. However D & R allows arbitrary instrumentation, which may not be possible with C & A.
D & R also allows combined optimisation of both application and instrumentation code, and is much closer to a dynamic optimisation system. A detailed discussion of Valgrind’s DBI framework can be found here [PDF].
My must-read book for this month
This month’s “must-read book” suggestion comes from one of our readers, M Kumaraswamy, who recommends the book Hadoop: The Definitive Guide by Tom White. Hadoop is an open source Apache project. Kumaraswamy claims that every programmer must know about Hadoop, whether you use it or not.
Most of the Internet’s large distributed programming environments have been based on Hadoop. If you are a student looking to write a data-intensive distributed application, Hadoop is obviously the framework to choose. It is based on Google’s MapReduce framework and the Google File System. It is an interesting architecture to study, understand and experiment with.
Tom White’s book contains detailed descriptions of the Hadoop Distributed File System (HDFS), MapReduce, Hadoop Cluster and Hadoop’s database, HBase. In short, it teaches you how to build a complex distributed system for data processing. Thank you, Kumaraswamy, for your suggestion that we should discuss Hadoop in detail in this column. We will definitely do that.
If you have a favourite programming book that you think is a must-read for every programmer, please do send me a note with the book’s name, and a short writeup on why you think it is useful, so I can mention it in this column. That would help many readers who want to improve their coding skills.
If you have any favourite programming puzzles that you would like to discuss on this forum, please send them to me, along with your solutions and feedback, at sandyasm_AT_yahoo_DOT_com. Till we meet again next month, happy programming, and here’s wishing you the very best!


